Sunday, May 14, 2017

Install Sonarqube on Ubuntu Part-1

Hello Guys,

Today I will show you how to install the sonarqube on ubuntu box and then will go with some configuration of sonarqube so lets start.

Lets install  JDK 8 on ubuntu

$ sudo apt-get install oracle-java8-installer

now lets install mysql on ubuntu

$ wget http://dev.mysql.com/get/mysql-apt-config_0.6.0-1_all.deb
 
$ sudo dpkg -i mysql-apt-config_0.6.0-1_all.deb

This will install the repo of mysql 5.7 on ubuntu server and now lets install mysql server sometimes unzip utility is not present on the server ubuntu server so install it exploratory. 

$ sudo apt-get update && sudo apt-get install mysql-server && sudo apt-get instll unzip zip

Create SonarQube database and user

$mysql -u root -p
 
Then create the database and a user:
 
mysql> CREATE DATABASE sonar CHARACTER SET utf8 COLLATE utf8_general_ci;
mysql> CREATE USER 'sonar' IDENTIFIED BY 'sonar';
mysql> GRANT ALL ON sonar.* TO 'sonar'@'%' IDENTIFIED BY 'sonar';
mysql> GRANT ALL ON sonar.* TO 'sonar'@'localhost' IDENTIFIED BY 'sonar';
mysql> FLUSH PRIVILEGES;
mysql> exit; 

So We have completed  prerequisite now lets move ahead with the installation of sonarqube
Download the latest source of sonarqube from https://www.sonarqube.org/
in my case its 6.3.1
$ wget  https://sonarsource.bintray.com/Distribution/sonarqube/sonarqube-6.3.1.zip
$ unzip sonarqube-6.3.1.zip
$ sudo sonarqube-6.3.1 /opt/sonar

Edit sonar.properties

Open /opt/sonar/conf/sonar.properties with your favourite text editor, and modify it.in my case its vim so

$ vim /opt/sonar/conf/sonar.properties

MySQL settings
Uncomment the user credentials and the MySQL related settings:

sonar.jdbc.username=sonar
sonar.jdbc.password=sonar

sonar.jdbc.url=jdbc:mysql://localhost:3306/sonar?useUnicode=true&characterEncoding=utf8&rewriteBatchedStatements=true&useConfigs=maxPerformance

Web Server settings
The following settings allow you to run the server on page http://localhost:9000/sonar
Copy sonar.sh to etc/init.d/sonar and modify it according to your platform.

$ sudo cp /opt/sonar/bin/linux-x86-64/sonar.sh /etc/init.d/sonar
$ sudo vim /etc/init.d/sonar

Insert two new lines:

SONAR_HOME=/opt/sonar
PLATFORM=linux-x86-64

Modify the following lines:

WRAPPER_CMD="${SONAR_HOME}/bin/${PLATFORM}/wrapper"
WRAPPER_CONF="${SONAR_HOME}/conf/wrapper.conf"
...
PIDDIR="/var/run"

Register as a Linux service:

$ sudo update-rc.d -f sonar remove
$ sudo chmod 755 /etc/init.d/sonar
$ sudo update-rc.d sonar defaults


now lets rock and role as the sonar is install on your local so lets start it with

$ /etc/init.d/sonar start

open the browser and http://<ip-address of server>:9000

remaing configuration section i will show you in the next article .


Monday, October 24, 2016

Installing Jenkins on Ubuntu 14.04

Jenkins is an open source Continuous Integration tool. Originally started as Hudson in 2004 but due to a dispute in 2011 they forked and continued under the name, Jenkins. It can be used to build software, deploy software, or websites to various endpoints or to run unit/behaviour-driven software tests. So lets start with the installation of jenkins first.
you will get surprise when know that worlds best compaines uses jenkins(compaines like Yahoo, NASA, Linkedin, Git Hub, Facebook, EMC, ebay).

so lets start with the installation first.It's really easy to install a jenkins on a ubuntu machine just need to use few command but as you are installing the package (new software) which will affect all the users of that Linux  box so you must have admin access(sudo) or you must have root access

Before we can install Jenkins, we have to add the key and source list to apt. This is done in 2 steps, first we'll add the key.
root@ubuntu.lan:~#wget -q -O - http://pkg.jenkins-ci.org/debian/jenkins-ci.org.key | apt-key add -
Secondly, we'll create a sources list for Jenkins.
root@ubuntu.lan:~# echo deb http://pkg.jenkins-ci.org/debian binary/ > /etc/apt/sources.list.d/jenkins.list
Now, we only have to update apt's cache before we can install Jenkins.
root@ubuntu.lan:~# apt-get update
As the cache has been updated we can proceed installing Jenkins. Note that Jenkins has a big bunch of dependencies, so it might take a few moments to install them all
root@ubuntu.lan:~# apt-get install jenkins

And Yes now the jenkins is installed on your local environment.In the next part we will install maven on the sonarqube on ubuntu on the port no 8080.open the webprobser on client machine ipaddress of jenkins machine:8080 .. 

Tuesday, September 20, 2016

List All the instances of AWS account using boto3 script


Hello Guys,
recently my boss has a requirement.He want to list all the instances of the AWS account across
the regions.So I have use boto3 library and so that we can use it any where with minimal setup.
  so I wrote a boto script to get it done.Here is the procedure to use it.step by step.

I am using ubuntu 16.04 as an operating system.below procedure  will also work fine with 
the ubuntu 14.04 as well.

1. Installation:

#sudo apt-get install python-softwware-properties

#sudo apt-get install  python-pip

#sudo pip install boto3
 
2. Configuring the boto3 library
 
Here we need to create few files like ~/.aws/credentials and ~/.aws/config
 
$ touch ~/.aws/credentials

 #Below are the contains of the file replace the foo and bar with the id and access key of your 
 AWS account

[default] 
aws_access_key_id=foo
aws_secret_access_key=bar
 
 
$ touch ~/.aws/config

#add the below containts to the file

region=us-west-2

and after this copy the below script and and execute it but remember in python orientation 
matters so dot change the orientation or the script will stop working.    


#!/usr/bin/env   python
from collections import defaultdict
"""
This script is Written by N.N.R.
on 12-09-16
"""
import boto3
"""
A tool for retrieving basic information from the running EC2 instances.
"""
client = boto3.client('ec2')
regions = client.describe_regions()['Regions']
for region in regions:
     region_name=region['RegionName']
# Connect to EC2
for region in regions:
 print("below are the instances running in")
 region_name=region['RegionName']
 print(region_name)
 ec2 = boto3.resource('ec2',region_name=region['RegionName'])
# Get information for all running instances
 running_instances = ec2.instances.filter(Filters=[{
    'Name': 'instance-state-name',
    'Values': ['running']}])
 ec2info = defaultdict()
 for instance in running_instances:
    for tag in instance.tags:
        if 'Name'in tag['Key']:
            name = tag['Value']
    # Add instance info to a dictionary
    ec2info[instance.id] = {
        'Name': name,
        'Type': instance.instance_type,
        'State': instance.state['Name'],
        'Private IP': instance.private_ip_address,
        'Public IP': instance.public_ip_address,
        'Launch Time': instance.launch_time
        }
 attributes = ['Name', 'Type', 'State', 'Private IP', 'Public IP', 'Launch Time']
 for instance_id, instance in ec2info.items():
    for key in attributes:
        print("{0}: {1}".format(key, instance[key]))
    print("------")


and Let me know if you have any issue with the script.


Saturday, February 13, 2016

Opensource Website analytical tool (Piwik)

Hello Guys,
                                                                Welcome back on my blog recently i am pretty busy with setting up the Nagios for the as i have describe in my previous post so can't able to update a new post. but after a wrapped up with that I started working on a brad new stuff. hope you will also like as its really very cool.As i have mention in title. its an open source web analytical tool same as google analytical tool.but its slightly different. as you are having it of your own. so Lets started implementing it.
               Piwik is an open-source and free alternative to Google Analytics tool. It tracks and displays reports about the location of user visits, Where they came from (i.e website, directly, or something else), the visitors browser, screen size, operating system details, what the visitors did on your website, the time of visits and more.

 Prerequisites

[root@server ~]# yum install mysql mysql-server httpd php php-mysql php-gd php-imap php-ldap php-odbc php-pear php-xml php-xmlrpc php-mbstring wget unzip -y
Start/Restart MySQL and Apache services now:

[root@server ~]# /etc/init.d/mysqld start
[root@server ~]# /etc/init.d/httpd start
[root@server ~]# chkconfig mysqld on
[root@server ~]# chkconfig httpd on
Create MySQL Root user password:

[root@server ~]# /usr/bin/mysql_secure_installation

NOTE: RUNNING ALL PARTS OF THIS SCRIPT IS RECOMMENDED FOR ALL MySQL
      SERVERS IN PRODUCTION USE!  PLEASE READ EACH STEP CAREFULLY!

In order to log into MySQL to secure it, we'll need the current
password for the root user.  If you've just installed MySQL, and
you haven't set the root password yet, the password will be blank,
so you should just press enter here.

Enter current password for root (enter for none):
OK, successfully used password, moving on...

Setting the root password ensures that nobody can log into the MySQL
root user without the proper authorisation.

Set root password? [Y/n] y
New password:
Re-enter new password:
Password updated successfully!
Reloading privilege tables..
 ... Success!

By default, a MySQL installation has an anonymous user, allowing anyone
to log into MySQL without having to have a user account created for
them.  This is intended only for testing, and to make the installation
go a bit smoother.  You should remove them before moving into a
production environment.

Remove anonymous users? [Y/n]
 ... Success!

Normally, root should only be allowed to connect from 'localhost'.  This
ensures that someone cannot guess at the root password from the network.

Disallow root login remotely? [Y/n]
 ... Success!

By default, MySQL comes with a database named 'test' that anyone can
access.  This is also intended only for testing, and should be removed
before moving into a production environment.

Remove test database and access to it? [Y/n]
 - Dropping test database...
 ... Success!
 - Removing privileges on test database...
 ... Success!

Reloading the privilege tables will ensure that all changes made so far
will take effect immediately.

Reload privilege tables now? [Y/n]
 ... Success!

Cleaning up...

All done!  If you've completed all of the above steps, your MySQL
installation should now be secure.

Thanks for using MySQL!
Create MySQL Database and user for Piwik:

[root@server ~]# mysql -u root -p
Enter password:
Welcome to the MySQL monitor.  Commands end with ; or \g.
Your MySQL connection id is 2
Server version: 5.1.69 Source distribution

Copyright (c) 2000, 2013, Oracle and/or its affiliates. All rights reserved.

Oracle is a registered trademark of Oracle Corporation and/or its
affiliates. Other names may be trademarks of their respective
owners.

Type 'help;' or '\h' for help. Type '\c' to clear the current input statement.

mysql> create database piwikdb;
Query OK, 1 row affected (0.02 sec)

mysql> GRANT ALL PRIVILEGES ON piwikdb.* TO 'piwikuser' IDENTIFIED BY 'centos';
Query OK, 0 rows affected (0.01 sec)

mysql> flush privileges;
Query OK, 0 rows affected (0.01 sec)

mysql> exit
Bye
Download Piwik

Download and extract Piwik software using the following commands:

[root@server ~]# wget http://builds.piwik.org/latest.zip
[root@server ~]# unzip latest.zip
Move the extracted Piwik folder to your apache root document folder:

[root@server ~]# mv piwik/ /var/www/html/piwik
Set the write permissions for the following directories:

[root@server ~]# chmod a+w /var/www/html/piwik/tmp/
[root@server ~]# chmod a+w /var/www/html/piwik/config/
Open the Apache default port 80 through your firewall/router:

[root@server html]# vi /etc/sysconfig/iptables
# Firewall configuration written by system-config-firewall
# Manual customization of this file is not recommended.
*filter
:INPUT ACCEPT [0:0]
:FORWARD ACCEPT [0:0]
:OUTPUT ACCEPT [0:0]
-A INPUT -p udp -m state --state NEW --dport 80 -j ACCEPT
-A INPUT -p tcp -m state --state NEW --dport 80 -j ACCEPT
-A INPUT -p udp -m state --state NEW --dport 53 -j ACCEPT
-A INPUT -p tcp -m state --state NEW --dport 53 -j ACCEPT
-A INPUT -m state --state ESTABLISHED,RELATED -j ACCEPT
-A INPUT -p icmp -j ACCEPT
-A INPUT -i lo -j ACCEPT
-A INPUT -m state --state NEW -m tcp -p tcp --dport 22 -j ACCEPT
-A INPUT -j REJECT --reject-with icmp-host-prohibited
-A FORWARD -j REJECT --reject-with icmp-host-prohibited
COMMIT
Restart the iptables to save the changes:

[root@server html]# /etc/init.d/iptables restart
Disable SELinux and reboot your system:

[root@server ~]# vi /etc/sysconfig/selinux
# This file controls the state of SELinux on the system.
# SELINUX= can take one of these three values:
#     enforcing - SELinux security policy is enforced.
#     permissive - SELinux prints warnings instead of enforcing.
#     disabled - No SELinux policy is loaded.
SELINUX=disabled
# SELINUXTYPE= can take one of these two values:
#     targeted - Targeted processes are protected,
#     mls - Multi Level Security protection.
SELINUXTYPE=targeted
Save and Reboot your computer.


and then open in your browser..http://<your server's ipaddress>/pwik.

and then bla bla a simple stpes of basic installation... and you are done...try it out..


for a testing it out I have added a sample site..192.168.100.5

created a simple index.html page

 [root@server ~]#vim /var/www/html/index.html

<html>
</header>
<!-- Piwik -->
<script type="text/javascript">
  var _paq = _paq || [];
  _paq.push(["setDocumentTitle", document.domain + "/" + document.title]);
  _paq.push(["setCookieDomain", "*.192.168.100.5"]);
  _paq.push(["setDomains", ["*.192.168.100.5"]]);
  _paq.push(['trackPageView']);
  _paq.push(['enableLinkTracking']);
  (function() {
    var u="//192.168.100.5/piwik/";
    _paq.push(['setTrackerUrl', u+'piwik.php']);
    _paq.push(['setSiteId', 2]);
    var d=document, g=d.createElement('script'), s=d.getElementsByTagName('script')[0];
    g.type='text/javascript'; g.async=true; g.defer=true; g.src=u+'piwik.js'; s.parentNode.insertBefore(g,s);
  })();
</script>
<noscript><p><img src="//192.168.100.5/piwik/piwik.php?idsite=2" style="border:0;" alt="" /></p></noscript>
<!-- End Piwik Code -->
</header>
<body>
<h1><hii/h1>
</body>
</html>

This is what i have  done to get the dash data on dash board..try it out...
bye gyus...
  

Saturday, January 2, 2016

Nagios 4.4.1 on ubuntu 15.04 for Monitoring your Infrastructure part-2

In the 1st part I have configured the nagios  and it have started to monitor the instance locally now come on the other part.adding clients to it .

Add Monitoring targets to Nagios server

Now, let us add some clients to monitor by Nagios server.
To do that we have to install nrpe and nagios-plugins in our monitoring targets.
On CentOS/RHEL/Scientifc Linux clients:
Add EPEL repository in your CentOS/RHEL/Scientific Linux 6.x or 7 clients to install nrpe package.
To install EPEL on CentOS 7, run the following command:
yum install epel-release
On CentOS 6.x systems, refer the following link.
Install “nrpe” and “nagios-plugins” packages in client systems:
yum install nrpe nagios-plugins-all openssl
On Debian/Ubuntu clients:
sudo apt-get update
sudo apt-get install nagios-nrpe-server nagios-plugins

Configure Monitoring targets

Edit /etc/nagios/nrpe.cfg file,
sudo nano /etc/nagios/nrpe.cfg
Add your Nagios server ip address:
[...]
## Find the following line and add the Nagios server IP ##
allowed_hosts=127.0.0.1 192.168.1.104
[...]
Start nrpe service on CentOS clients:
CentOS 7:
systemctl start nrpe
chkconfig nrpe on
CentOS 6.x:
service nrpe start
chkconfig nrpe on
For Debian/Ubuntu Clients, start nrpe service as shown below:
sudo /etc/init.d/nagios-nrpe-server restart

Now, go back to your Nagios server, and add the clients ( in the configuration file.
To do that, Edit “/usr/local/nagios/etc/nagios.cfg” file,
sudo nano /usr/local/nagios/etc/nagios.cfg
and uncomment the following lines.
## Find and uncomment the following line ##
cfg_dir=/usr/local/nagios/etc/servers
Create a directory called “servers” under “/usr/local/nagios/etc/”
sudo mkdir -p /usr/local/nagios/etc/servers
Copy the localhost.cfg to the server directory with the client name you want i have use cl1
sudo cp  -ar /usr/local/nagios/etc/objects/localhost.cfg \ /usr/local/nagios/etc/servers/cl1.cfg
Create a file called groups.cfg in side of  /usr/local/nagios/etc/servers/ directory 
Add a definition of new group for client or in the groups file add the following lines
(if you are really new with Nagios)
###############################################################################
###############################################################################
#
# HOST GROUP DEFINITION
#
###############################################################################
###############################################################################

# Define an optional hostgroup for Linux machines

define hostgroup{
        hostgroup_name  linux-server ; The name of the hostgroup
        alias           Linux Server ; Long name of the group
        members         cl1     ; Comma separated list of hosts that belong to this group
        }
After this save and close the file and lets go to the cl1.cfg file.
change the host ip for me it was 192.168.100.4 it may me some thing else for you.
define host{
        use                     linux-server            ; Name of host template to use
                                                        ; This host definition will inherit all variables that are defined
                                                        ; in (or inherited by) the linux-server host template definition.
        host_name               cl1
        alias                   cl1.centos.lan
        address                 192.168.100.4
        }
change only which are in bold only. and then remove the section of hot group from the file or you can comment it out. after that seatch for localhost in the file and replace it with your value of host_name in my case its cl1  and save and close the file. if you are not able to do it then fire the below command and it will tale care of the rest for you.
sed -i 's/localhost/cl1/g' /usr/local/nagios/etc/servers/cl1.cfg
it will replace all the occurances of localhost with cl1. and we are almost done.

 fire this command and check if you have done any configuration error
sudo /usr/local/nagios/bin/nagios -v /usr/local/nagios/etc/nagios.cfg
  and We are done we have successfully added a client to our nagisos. just dont forget ot restart your nagios with also add the required rule in iptables or you can face some issue with it am sure you can manage this 
sudo systemctl restart nagios
login on your web interface.We have successfully added our first client to nagios for monitoring


Gyus enjoy I will also wotking on PNP4nagios will explain you in the next part how you can have some cool graph of the system performance generated using nagios.


Nagios 4.4.1 on ubuntu 15.04 for Monitoring your Infrastructure

Hello Techies,
Welcome to my blog again.Just looking at the infra motioning few days back in my office.My boss comes with a requirement that he want to monitor on the disk of  all the servers including the developer's environment.I have a choice to write a custom shell script and get  job done or to take it as an opportunity and  configure some robust monitoring which will help me in feature also.
            So I have choose the 2nd way and decided to go with Nagios and put motioning on all the available system not just for only dick checks also for the software and for OS.I have done it in the past but want to do it in easier fashion so the guys with less understanding  with Nagios can also able to add the system so i need a way to do it so I have done a bit a research and come to with this solution
     I have choose Ubuntu 15.04 for Nagios server OS and Nagios 4.1.1 as my Nagios version.
I have installed the ubuntu.

I have installed LAMP stack on the server using the below commands
sudo apt-get install apache2 mysql-server mysql-client php5 php5-mysql php5-gd php5-tidy
Then install the following prerequisites:
sudo apt-get install build-essential libgd2-xpm-dev apache2-utils unzip

Create Nagios User And Group

Create a new nagios user account:
sudo useradd -m nagios
sudo passwd nagios
Create a new nagcmd group for allowing external commands to be submitted through the web interface. Add both the nagios user and the apache user to the group.
sudo groupadd nagcmd
sudo usermod -a -G nagcmd nagios
sudo usermod -a -G nagcmd www-data

Download Nagios And Plugins

Go to the nagios download page, and get the latest version. As of writing this, the latest version was 4.1.1.
wget https://assets.nagios.com/downloads/nagioscore/releases/nagios-4.1.1.tar.gz
And, download nagios plugins too. Nagios plugins allow you to monitor hosts, devices, services, protocols, and applications with Nagios
wget http://www.nagios-plugins.org/download/nagios-plugins-2.1.1.tar.gz

Install Nagios And Plugins

Install nagios:
Go to the folder where you’ve downloaded nagios, and extract it using command:
tar xzf nagios-4.1.1.tar.gz
Change to the nagios directory:
cd nagios-4.1.1/
Run the following commands one by one from the Terminal to compile and install nagios.
sudo ./configure --with-command-group=nagcmd
sudo make all
sudo make install
sudo make install-init
sudo make install-config
sudo make install-commandmode
Install Nagios Web interface:
Enter the following commands to compile and install nagios web interface.
sudo make install-webconf
You may get the following error:
/usr/bin/install -c -m 644 sample-config/httpd.conf /etc/httpd/conf.d/nagios.conf
/usr/bin/install: cannot create regular file ‘/etc/httpd/conf.d/nagios.conf’: No such file or directory
Makefile:296: recipe for target 'install-webconf' failed
make: *** [install-webconf] Error 1
The above error message describes that nagios is trying to create the nagios.conf file inside the /etc/httpd.conf/directory. But, in Ubuntu systems the nagios.conf file should be placed in /etc/apache2/sites-enabled/directory.
So, run the following command instead of using sudo make install-webconf.
sudo /usr/bin/install -c -m 644 sample-config/httpd.conf /etc/apache2/sites-enabled/nagios.conf
Check if nagios.conf is placed in /etc/apache2/sites-enabled directory.
sudo ls -l /etc/apache2/sites-enabled/
Sample output:
total 4
lrwxrwxrwx 1 root root 35 Nov 28 16:49 000-default.conf -> ../sites-available/000-default.conf
-rw-r--r-- 1 root root 1679 Nov 28 17:02 nagios.conf
Create a nagiosadmin account for logging into the Nagios web interface. Remember the password you assign to this account. You’ll need it while logging in to nagios web interface..
sudo htpasswd -c /usr/local/nagios/etc/htpasswd.users nagiosadmin
Restart Apache to make the new settings take effect.
In Ubuntu 15.10/15.04:
sudo systemctl restart apache2
Install Nagios plugins:
Go to the directory where you downloaded the nagios plugins, and extract it.
tar xzf nagios-plugins-2.1.1.tar.gz
Change to the nagios plugins directory:
cd nagios-plugins-2.1.1/
Run the following commands one by one to compile and install it.
sudo ./configure --with-nagios-user=nagios --with-nagios-group=nagios
sudo make
sudo make install
Wait, We are not finished yet.

Configure Nagios

Nagios sample configuration files will be found in the /usr/local/nagios/etc directory. These sample files should work fine for getting started with Nagios. However, if you want, you’ll need to put your actual email ID to receive alerts.
To do that, Edit the /usr/local/nagios/etc/objects/contacts.cfg config file with your favorite editor and change the email address associated with the nagiosadmin contact definition to the address you’d like to use for receiving alerts.
sudo nano /usr/local/nagios/etc/objects/contacts.cfg
Find the following line and enter the email id:
[...]
define contact{
        contact_name                    nagiosadmin             ; Short name of user
        use                             generic-contact         ; Inherit default values from generic-contact template (defined above)
        alias                           Nagios Admin            ; Full name of user
        email                           vijay9867206455@gmail.com  ; <<***** CHANGE THIS TO YOUR EMAIL ADDRESS ******
        }
[...]
Save and close the file.
Then, Edit file /etc/apache2/sites-enabled/nagios.conf,
sudo nano /etc/apache2/sites-enabled/nagios.conf
And edit the following lines if you want to access nagios administrative console from a particular IP series.
Here, I want to allow nagios administrative access from 192.168.1.0/24 series only. So, I edited this file as shown below.
[...]
## Comment the following lines ##
#   Order allow,deny
#   Allow from all
## Uncomment and Change lines as shown below ##
Order deny,allow
Deny from all
Allow from 127.0.0.1 192.168.1.0/24
[...]
Enable Apache’s rewrite and cgi modules:
sudo a2enmod rewrite
sudo a2enmod cgi
Restart apache service.
sudo systemctl restart apache2
Check nagios,conf file for any syntax errors:
sudo /usr/local/nagios/bin/nagios -v /usr/local/nagios/etc/nagios.cfg
If there are no errors, start nagios service and make it to start automatically on every boot.
sudo service nagios start
sudo ln -s /etc/init.d/nagios /etc/rcS.d/S99nagios
Note: In Ubuntu 15.10/15.04, you will see the following error message while starting nagios service.
Failed to start nagios.service: Unit nagios.service failed to load: No such file or directory.
Or
[....] Starting nagios (via systemctl): nagios.serviceFailed to start nagios.service: Unit nagios.service failed to load: No such file or directory.
failed!
To fix this error, copy /etc/init.d/skeleton to /etc/init.d/nagios using the following command:
sudo cp /etc/init.d/skeleton /etc/init.d/nagios
Edit file /etc/init.d/nagios:
sudo nano /etc/init.d/nagios
Add the following lines:
DESC="Nagios"
NAME=nagios
DAEMON=/usr/local/nagios/bin/$NAME
DAEMON_ARGS="-d /usr/local/nagios/etc/nagios.cfg"
PIDFILE=/usr/local/nagios/var/$NAME.lock
Save and close the file.
Finally you need to change the permissions of the file
sudo chmod +x /etc/init.d/nagios
Now, you can start nagios service using command:
sudo /etc/init.d/nagios start

Access Nagios Web Interface

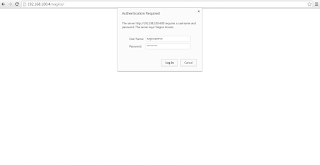
Open up your web browser and navigate to http://nagios-server-ip/nagios and enter the username as nagiosadmin and its password which we created in the earlier steps.

192.168.1.103-nagios – Google Chrome_001
Here it is how Nagios administrative console looks like:

Nagios Core – Google Chrome_002
Click on the “Hosts” section in the left pane of the console. You will see there the no of hosts being monitored by Nagios server. We haven’t added any hosts yet. So it simply monitors the localhost itself only.


Nagios Core – Google Chrome_003
Click on the localhost to display more details:

Nagios Core – Google Chrome_004
That’s it. We have successfully installed and configure Nagios core in our Ubuntu 15.04 server.Till now it all sounds good and we have done with the 1st part of configuring the nagios and its also start monitoring itself locally now We have too add clients to it.
I will couver that in the second part how easily you can add client and configure the alert on it also with some more cool stuff.
Enjoy...